
Dr. Nick Wong needed a way to visualize a bisulfite analysis paper he was working on.
Bisulfite analysis allows researchers to see regulation patterns within cell networks. Nick was generating large amounts of data, but didn't have a good way to visualize the patterns he was looking for in his data.
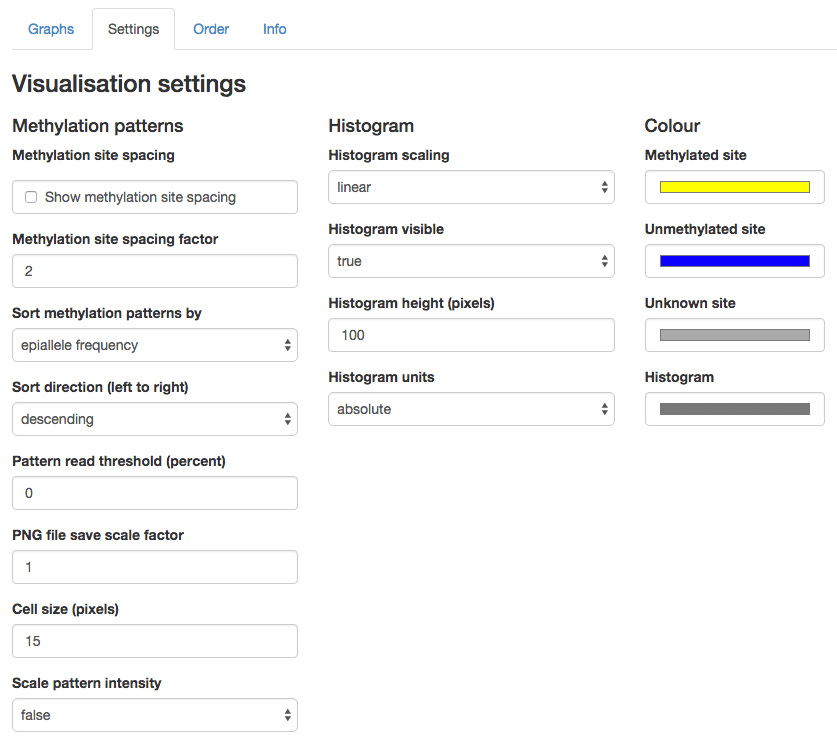
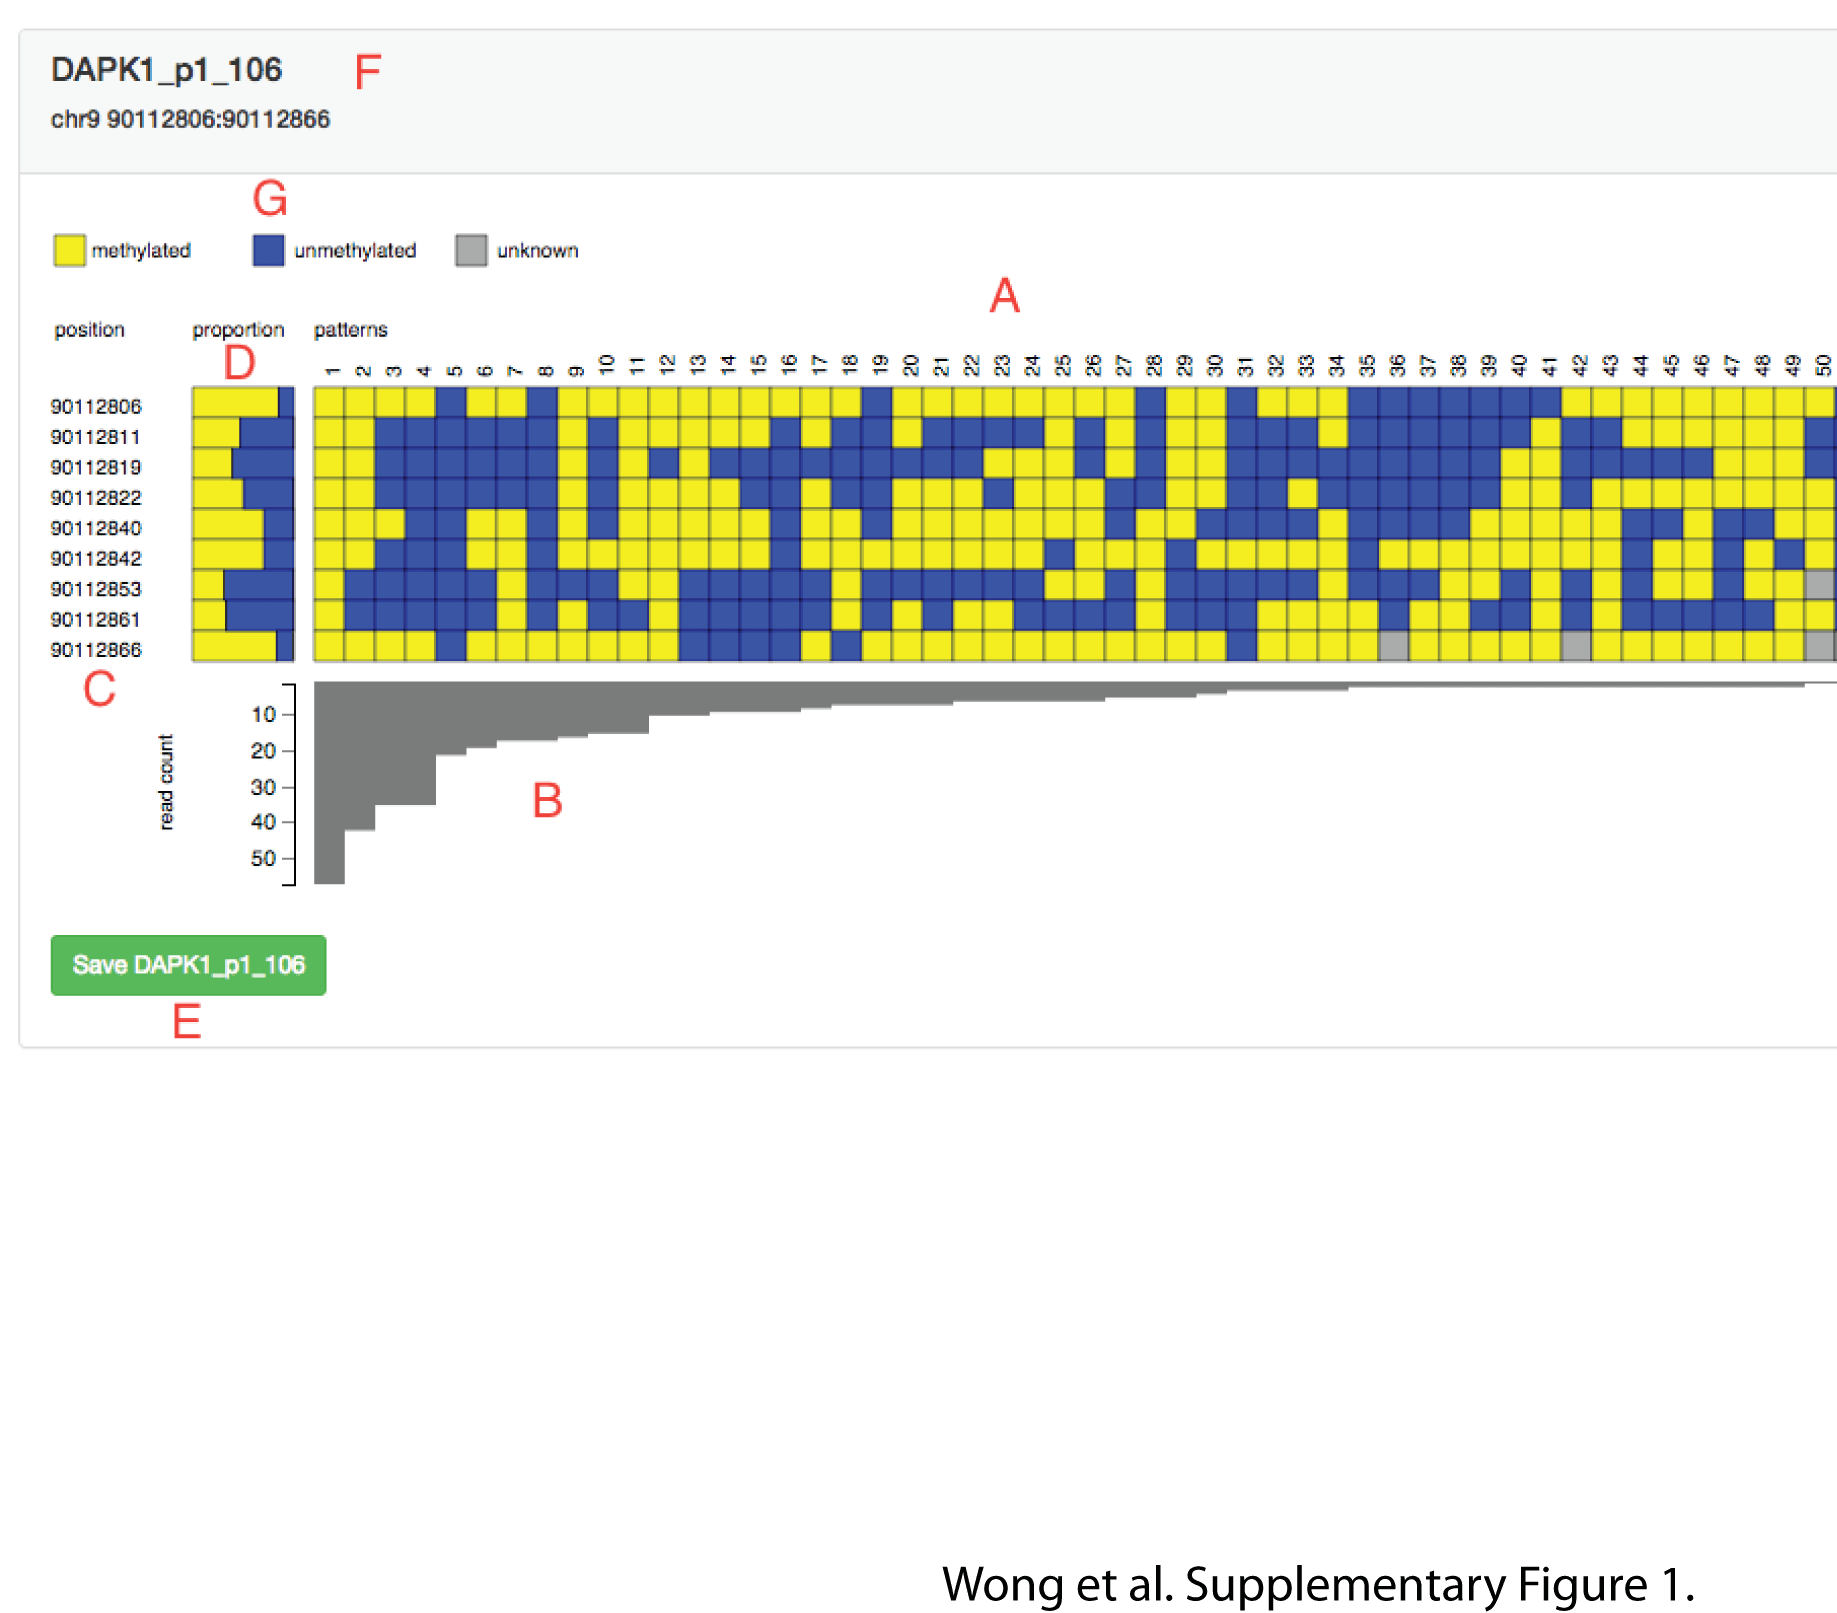
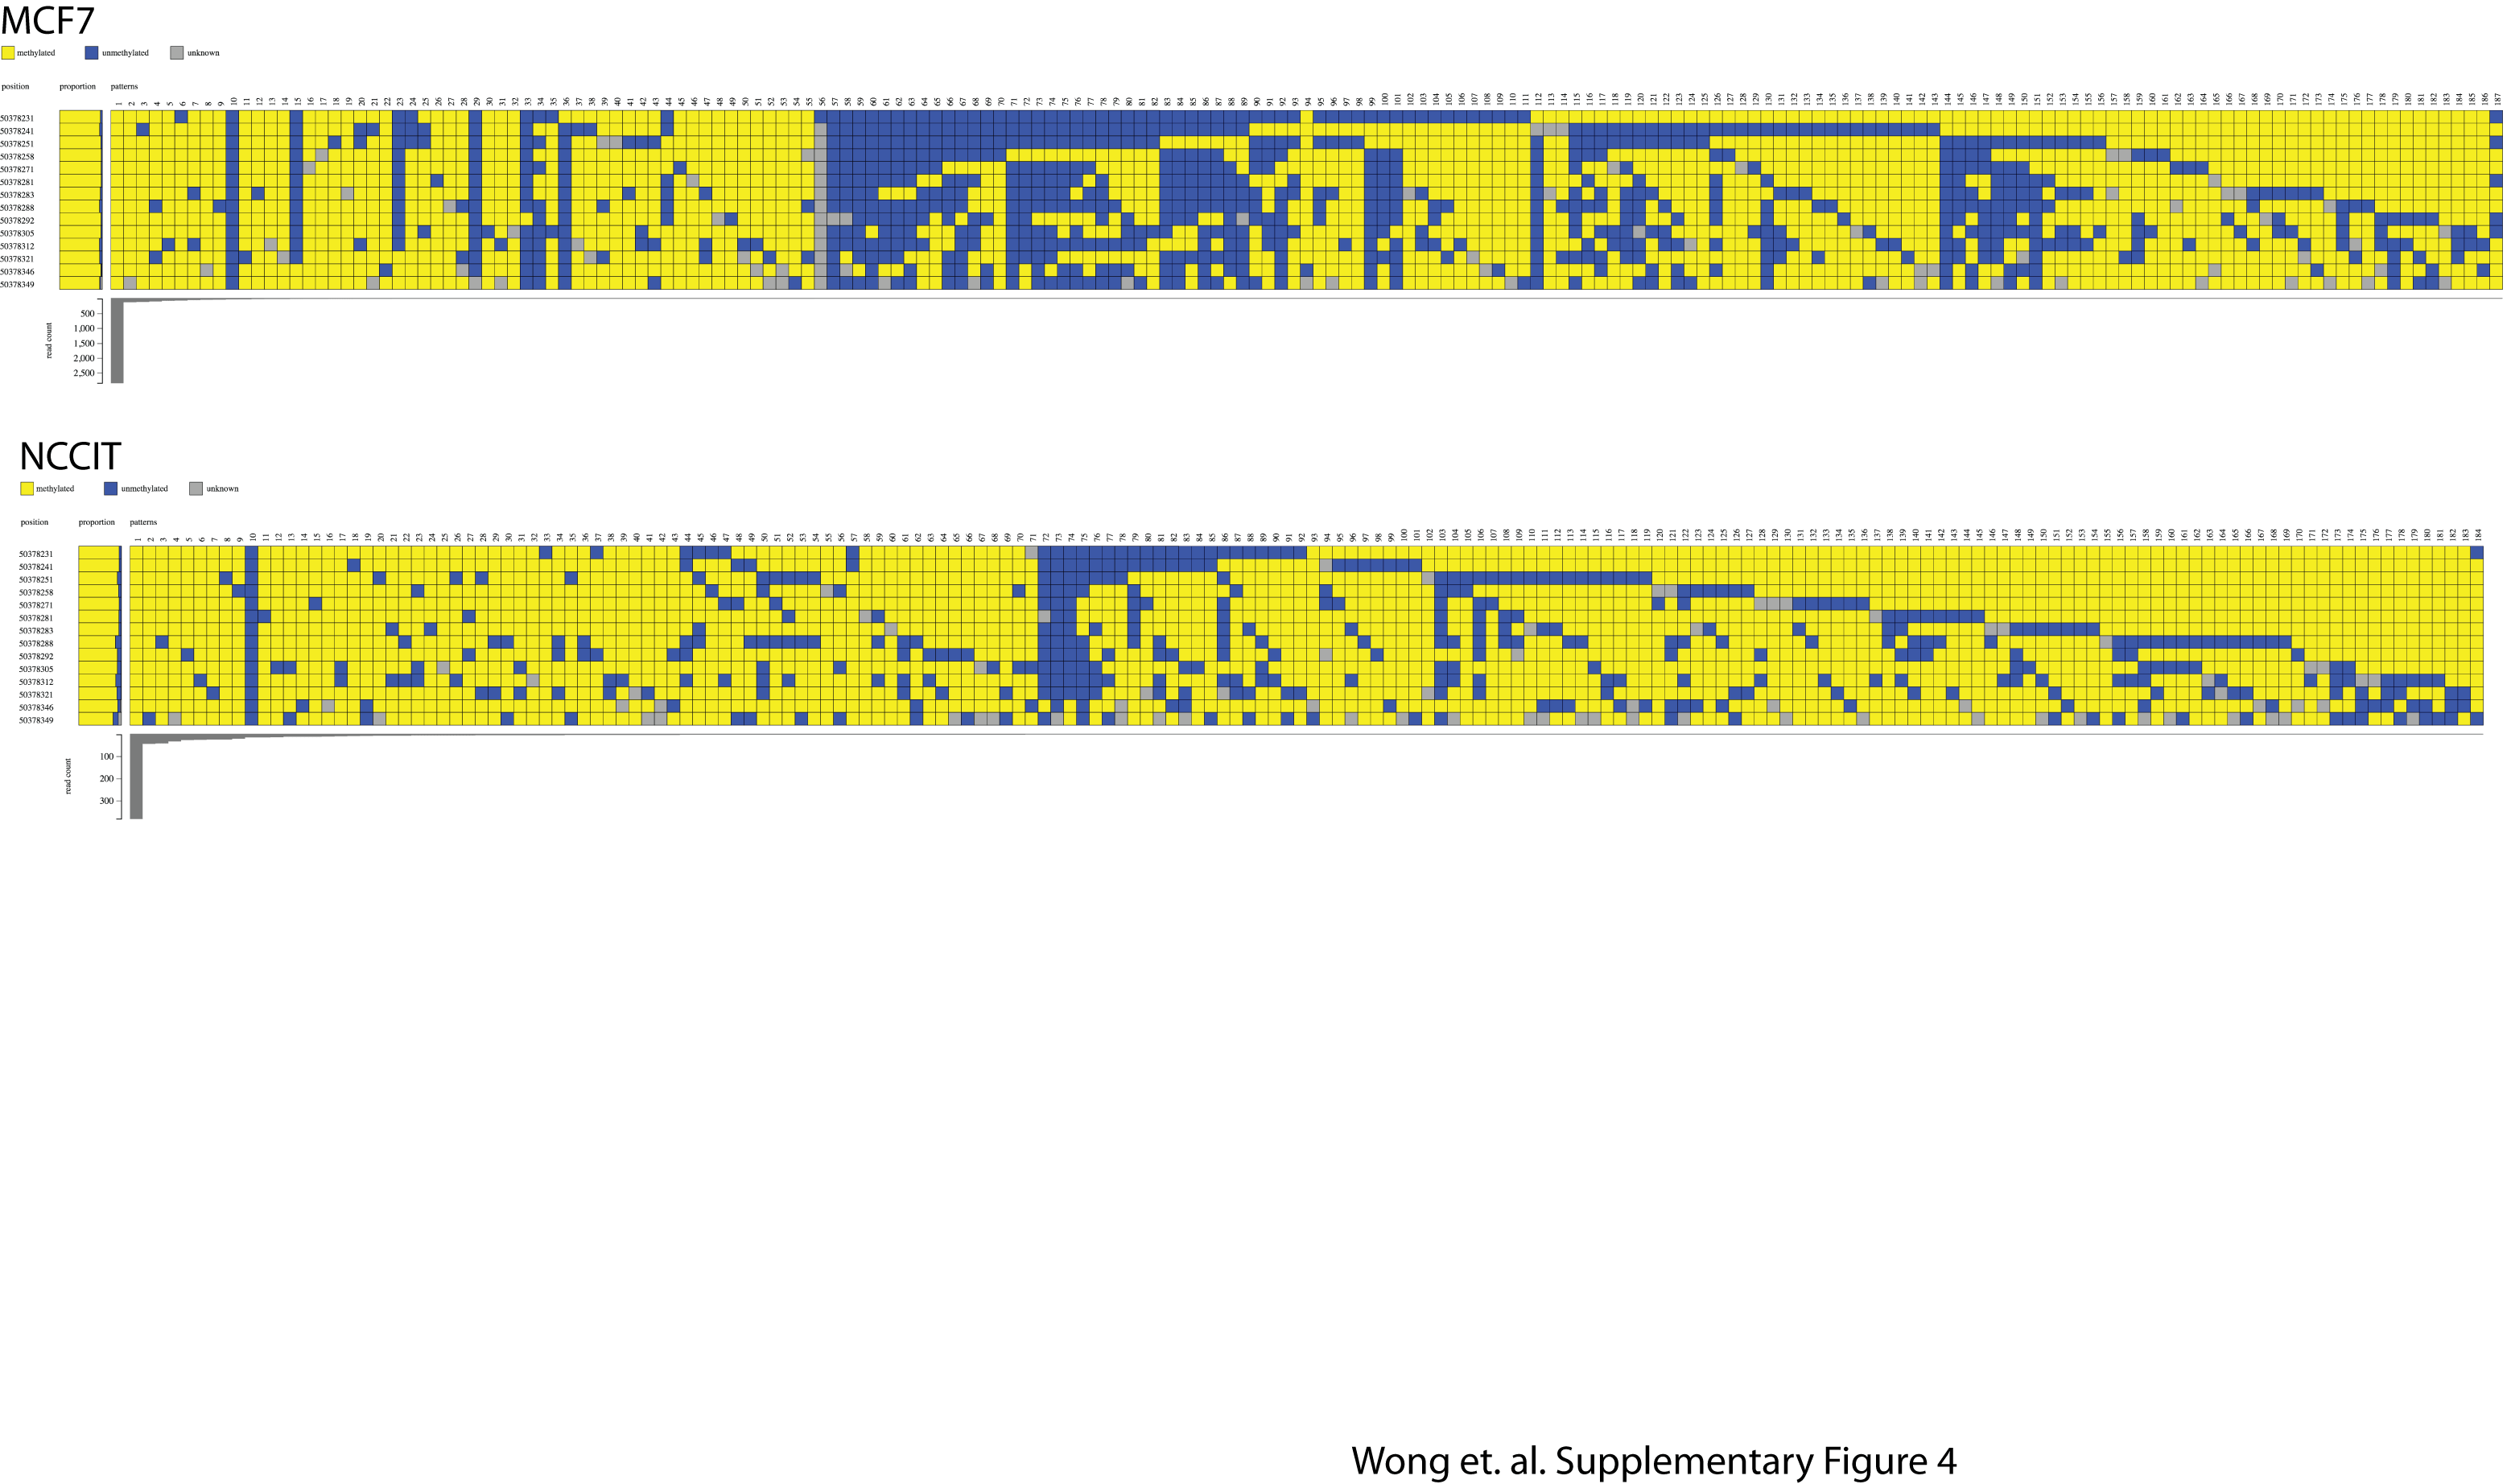
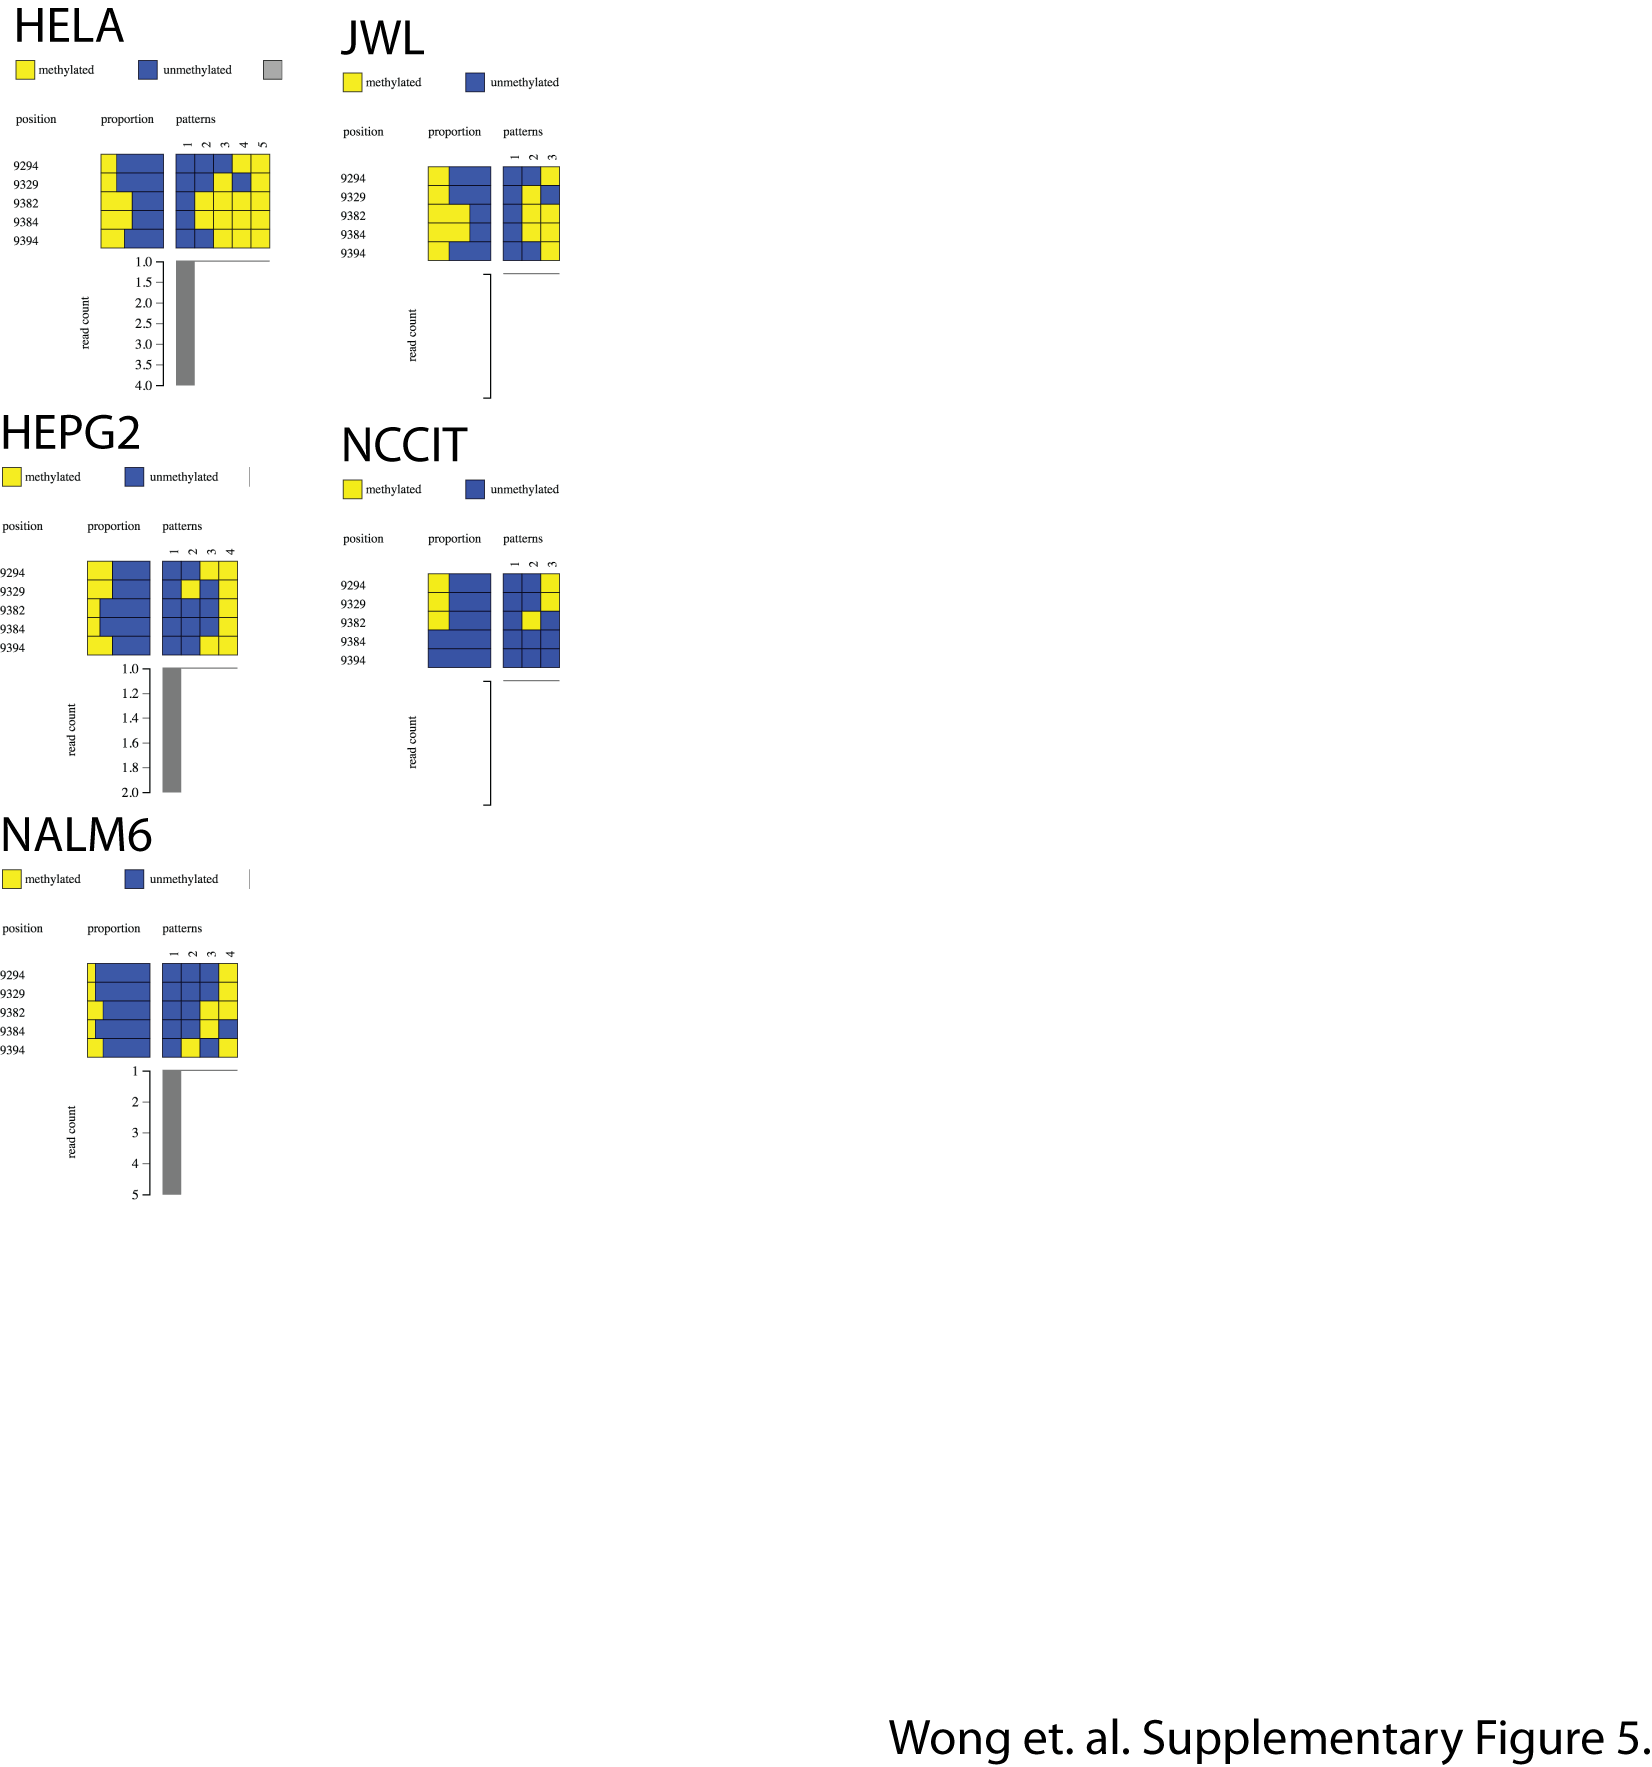
We generated different types of visualizations to discover which tools allowed the easiest interpretation of bisulfite analysis. Large heatmaps were selected as the best way to interpret the data we were trying to visualize.
We generated some great heatmaps that allowed Nick's group to discover how genes and transcripts are being regulated in different disease states.
2 bioinformatics developers and 1 biochemist.
 (650) 353 7636